Medicaid Coverage for the National DPP Demonstration Project


The Evaluation
NACDD worked with RTI International to evaluate the process for Medicaid coverage and delivery of the National Diabetes Prevention Program (National DPP) lifestyle change program in Maryland and Oregon, analyze the cost of the different delivery models, and evaluate various enrollment, engagement and retention strategies, and participant outcomes for demonstration participants. The multimethod evaluation included program implementation surveys, interviews, and cost surveys with state, managed care organizations (MCOs) in Maryland and coordinated care organizations (CCOs) in Oregon, and CDC-recognized organization staff, and pre/post telephone surveys with Medicaid beneficiary participants. The executive summary of the evaluation report was released on 1/10/19. Click a link below to scroll directly to that section of the Evaluation results:
- Demonstration Organizations
- Medicaid Beneficiary Participants
- Patient Reported Characteristics
- Recruitment / Enrollment
- Retention
- Weight Loss
- Other Participant Outcomes
- Cost
To learn more about evaluation methods and examples of other states that have evaluated the National DPP lifestyle change program, please see the evaluation section of the Data, Reporting, and Evaluatio page.
Evaluation Results:
Demonstration Organizations
- 2 State Medicaid and public health agencies
- 4 MCOs, 3 CCOs
- 20 total CDC-recognized organizations (2 online)
Across both states, relationships among the state agencies, MCO/CCOs, and CDC-recognized organizations were keys to success in planning and implementing Medicaid coverage of the National DPP lifestyle change program. Specific recommendations and lessons learned for organizations included:
- Provide at least a 6-month period for project planning
- Assess CDC-recognized organizations’ needs for technical assistance to engage with MCOs and Medicaid
- Incorporate program supports and services to facilitate attendance (e.g., flexible program locations and timing [including make-up sessions], transportation assistance, child care)
- Use tailored, frequent contact by trained lifestyle coaches to encourage retention
- Engage with health care providers to establish a referral process.
Medicaid Beneficiary Participants
- 913 Medicaid beneficiaries completed at least one session, 856 had attendance and weight data submitted
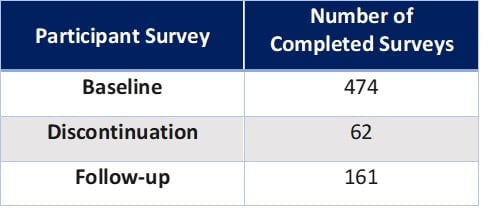
The inclusion of a participant survey in the Medicaid Demonstration Project is a relatively rare aspect of a diabetes prevention intervention evaluation and provides a unique perspective on Medicaid beneficiary satisfaction and experience with the program. Participants were offered the opportunity to complete two phone surveys: 1) Baseline Survey – administered after enrollment; and 2) either a Discontinuation Survey – administered to those who did not complete at least 4 sessions within 6 months of enrollment OR a Follow-Up Survey – administered to all remaining participants.
Because of program implementation and enrollment delays and to allow sufficient time for data analysis, participant data collection ended prior to implementation. Data collection occurred for 17 months from February 2017-June 2018 and program implementation occurred for 24 months from February 2017-January 2019. Therefore, collection of complete data for all participants enrolling later in the implementation period was not possible and follow-up survey and outcomes data were collected for some participants from 6 to 12 months and not at 12 months as originally planned.
Participant Reported Characteristics (Baseline Survey Data):
- 50.2% non-Hispanic African-American
- 76.6% female
- Average age: 45 years
- Average age was statistically significantly higher for in-person (50 yrs) than online (41 yrs) participants
- 51.7% reported co-morbid hypertension
- 37.3% reported co-morbid high cholesterol
Recruitment/Enrollment
Most recruitment efforts were completed by internal staff at MCOs/CCOs and CDC-recognized organizations through direct outreach to eligible participants, such as phone calls, text messages, emails, or direct, targeted mailings to eligible MCO/CCO members. Participants were also recruited through health fairs or community outreach activities and through their health care providers. Participants reported enrolling to:
- Lose weight
- Become healthier
- Form healthy eating habits
- Reduce the risk of type 2 diabetes
Organizations reported that eligible members did not respond well to impersonal attempts to disseminate information about the program, including mass mailings or emails. Organizations also reported that focusing on a few health care provider groups to obtain referrals, establishing a formal health care provider referral process, and increasing contact between CDC-recognized organizations with clinics would have facilitated participant enrollment.
A brief summarizing strategies used by Maryland and Oregon to support enrollment and recruitment during the Medicaid Coverage for the National DPP Demonstration Project can be found here.
Retention
MCOs/CCOs and CDC-recognized organizations used program supports (such as pedometers, gym memberships, cookbooks, scales, or trackers), program services (such as transportation and child care assistance), incentives, and text, phone, and email reminders to help retain participants in the program. MCOs also reported contacting members who were not regularly participating to determine their barriers to participation and help devise ways to keep them in the program. One CDC-recognized organization staff member reported that “Our goal was to provide them with incentives … but then also acknowledging some of the barriers. So, we were able to partner with the bus company and provide bus transportation for our members who lack transportation and childcare.”
Some lifestyle coaches reported stressing accountability in their interactions with participants by reinforcing the importance of tracking physical activity and weighing in. In addition, they fostered group cohesion through interactive class activities and gatherings outside of class, in order to help participants feel accountable to the group. One lifestyle coach said, “I think they’re coming for more than just the nutrition and the physical activity tips. They’re really coming to be supportive of each other and I think that’s what sets it apart.”
Retention was measured in several ways for Demonstration participants. Among participants with at least 6 months of enrollment by the data collection deadline (n=673), 25.6% attended fewer than four sessions (discontinued). Participants who were referred from a health care source and those who noted they received program support tools such as pedometers, scales, or athletic gear or clothing, were more likely to attend at least four sessions within 6 months of enrollment.
Overall, retention results were encouraging for participants for whom 12 months had elapsed since enrollment with better outcomes for in-person participants:
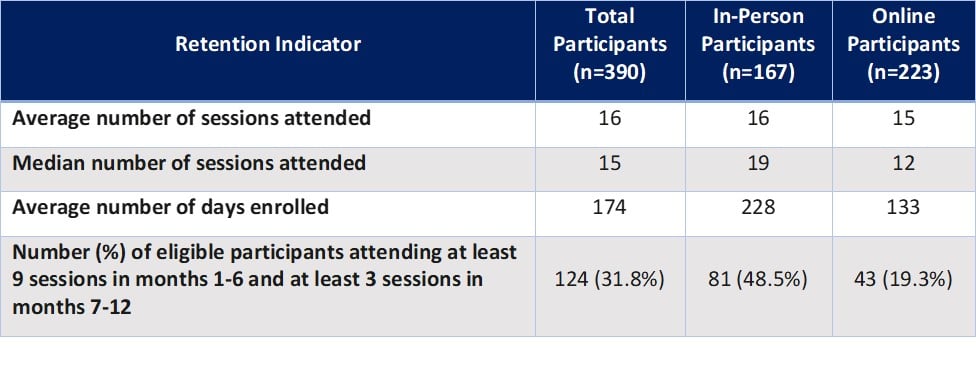
Retention was compared between Demonstration participants (in-person and online) and participants in the national DPRP registry (in-person, online, distance, and combination) who met the 2018 DPRP Standards’ criteria of having 12 months elapsed since enrollment, attending 3 or more sessions in the first 6 months, and remaining in the program for at least 9 months. Demonstration participants attended an average of 19 sessions in the first 6 months and 8 sessions in the second 6 months (n = 129), compared with 17 sessions and 7 sessions, respectively, for participants in the national DPRP registry using 2018 DPRP Standards’ criteria.
Analysis was also conducted to examine the impact of participant characteristics on retention with participants with at least 12 months of enrollment and who had a completed baseline survey (n=164). Overall, older age was statistically significantly associated with attending additional sessions, and participants who reported being in excellent or good health attended five more sessions on average than those indicating their health was satisfactory, unsatisfactory, or poor.
The most common reasons for leaving the program reported on the Participant Discontinuation Survey were general time constraints, technological issues or resistance to frequent log-ins (online), family commitments, inconvenient timing (in-person), no reliable access to classes, and inability to meet goals. CDC-recognized staff also reported participant challenges which included lack of transportation and childcare, major life changes, and health or disability challenges.
A brief summarizing the strategies used by Maryland and Oregon to increase participant retention during the Medicaid Coverage for the National DPP Demonstration Project can be found here.
Weight Loss
Weight loss was compared between Demonstration participants (in-person and online) and participants in the national DPRP registry (in-person, online, distance, and combination) who met the 2018 DPRP Standards’ criteria of having 12 months elapsed since enrollment, attending 3 or more sessions in the first 6 months, and remaining in the program for at least 9 months. Demonstration participants lost an average of 4.5% of their body weight (n = 122), compared to 6% among participants in the national DPRP registry using the 2018 DPRP Standards’ criteria.
For the full sample of participants for whom 12 months had elapsed since enrollment, weight loss was higher for online than in-person participants. Retention was a statistically significant predictor of weight loss. For every additional session attended, participants on average lost an additional 0.11% of weight.
Other Participant Outcomes
Survey data provided additional information about participant satisfaction, knowledge, and behavior:
- Pre/post data showed a statistically significant increase in the percentage of participants reporting they expected to exercise or currently did exercise 30 minutes at least five days a week
- 93% of participants reported at follow-up they were satisfied or very satisfied with the program
- 86% of participants reported at follow-up they were satisfied or very satisfied with the lifestyle coaches
- 90% of participants reported they were likely or extremely likely to recommend the program
- Over 50% of participants reported their friends and family had benefited from their program participation by eating healthier food and gaining information about healthy eating
- Data from the Follow-Up Survey indicated that since starting the National DPP lifestyle change program:
- 74% reported their overall health was better
- 78% reported they were more likely to visit their personal doctor or health care provider
- 85% reported changing their physical activities or exercise routine
- 91% reported changing the way they eat with over half reporting they: read food labels, ate more vegetables, and grilled or baked food more often.
Cost
For the cost study, state and MCO/CCO staff reported actual costs of activities on a quarterly basis throughout the evaluation period (July 1, 2016 – June 30, 2018) and projected costs through the end of enrollment (January 31, 2019). As early adopters in implementing Medicaid coverage for the National DPP lifestyle change program, many labor hours were spent in both states on planning and activities that may assist future states who plan to implement coverage. Therefore, costs reported from the Demonstration could be decreased for other states and organizations.
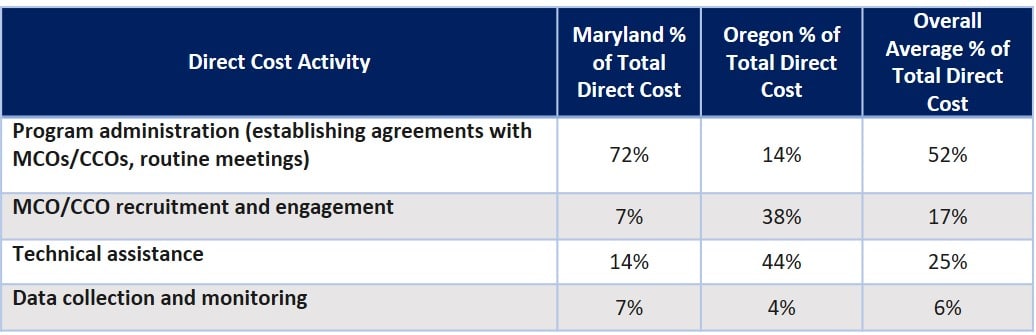
- State Agencies
- 98% of state costs were direct costs (labor, material, and services). Activities making up the largest components of direct costs differed between the two states:
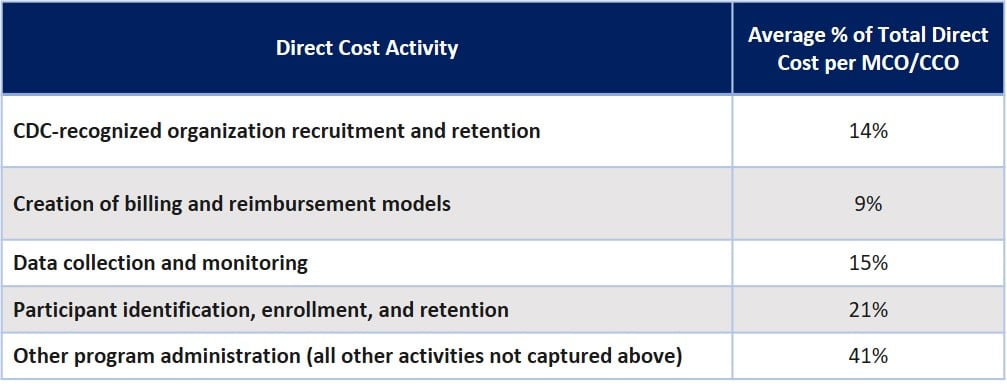
- MCOs/CCOs
- MCO/CCO costs were: 65% direct costs (labor, material, and services), 20% payments to CDC-recognized organizations, 14% indirect costs (overhead).
- Although extensive evaluation of program characteristics associated with MCO/CCO costs was not possible due to low sample size, exploratory analyses indicated:
- MCO/CCOs providing varying incentives for the in-person and online program participants had lower costs
- Hiring personnel with specialized certifications, such as certified diabetes educator, community health advocate, or licensed practical nurse was associated with higher costs
- Identifying eligible participants through claims data, through health care providers, and through external vendors was associated with higher total costs
- MCO/CCOs providing payments for weight loss had higher costs than those that did not
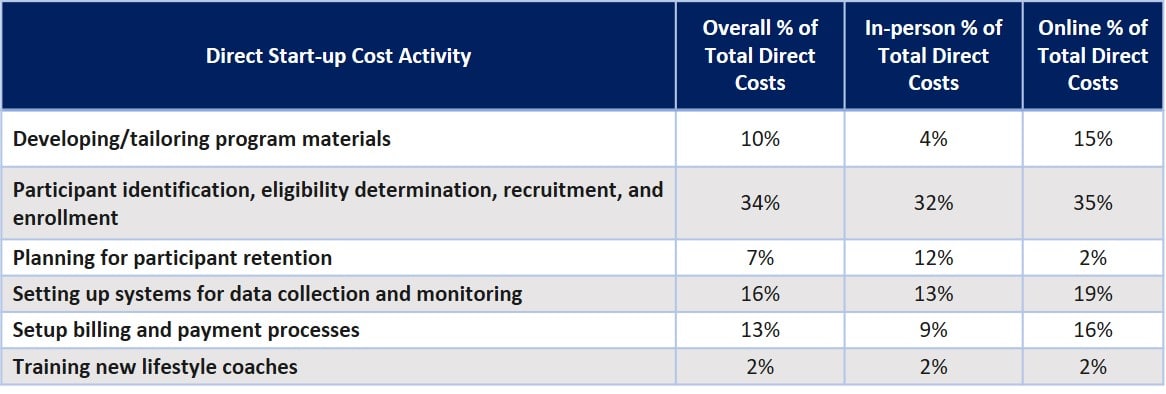
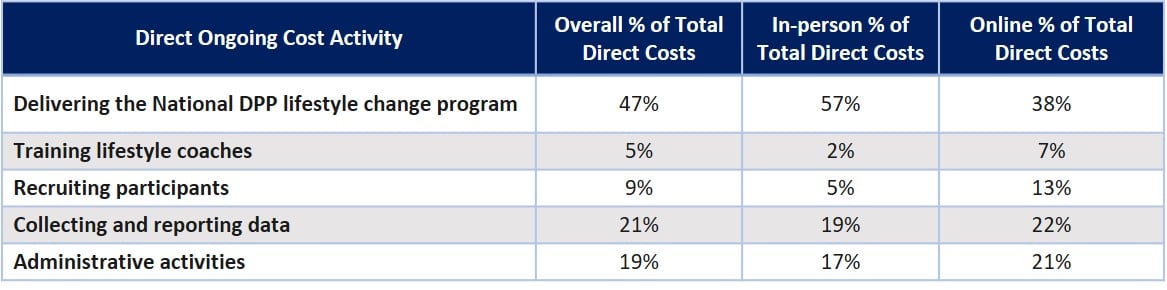
- CDC-recognized organizations reported start-up costs as well as ongoing program costs in a typical month for the entire program.
- CDC-recognized organization costs were: 88% direct costs (labor, material, and services), 12% indirect costs (overhead)
- Start-up Costs: Online CDC-recognized organizations reported substantially higher start-up costs than in-person organizations
- Ongoing Costs: Actual delivery of the program accounted for less than half of the ongoing direct costs for CDC-recognized organizations (higher for in-person).
- Although extensive evaluation of program characteristics associated with CDC-recognized organization costs were not possible due to low sample size, exploratory analyses indicated:
- CDC-recognized organizations with a greater number of active enrollees had lower costs
- CDC- recognized organizations with multiple recruitment efforts and incentives had lower costs
- CDC-recognized organizations expressing difficulty incorporating the program into their workflow had higher costs
- CDC-recognized organizations with lifestyle coaches with multiple credentials and where lifestyle coach training was required had lower costs
- CDC-recognized organizations with more experience providing the National DPP lifestyle change program had lower costs
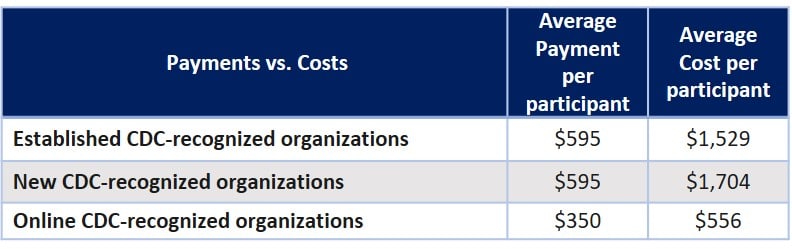
- Payments to CDC-recognized organization did not cover all costs to administer the program
Questions about the evaluation or to learn more, please contact coveragetoolkit@chronicdisease.org and review the Medicaid Coverage for the National DPP Demonstration Project Evaluation Report Executive Summary.